Overview of Analyze in SocialBu
The Analyze feature in SocialBu helps you understand how your content, accounts, networks, and team are performing. It brings together publishing activity, audience growth, engagement, top posts, and platform-specific metrics so you can make better social media decisions.
Written By Ghina Rehman
Last updated 21 days ago
What is Analyze in SocialBu?
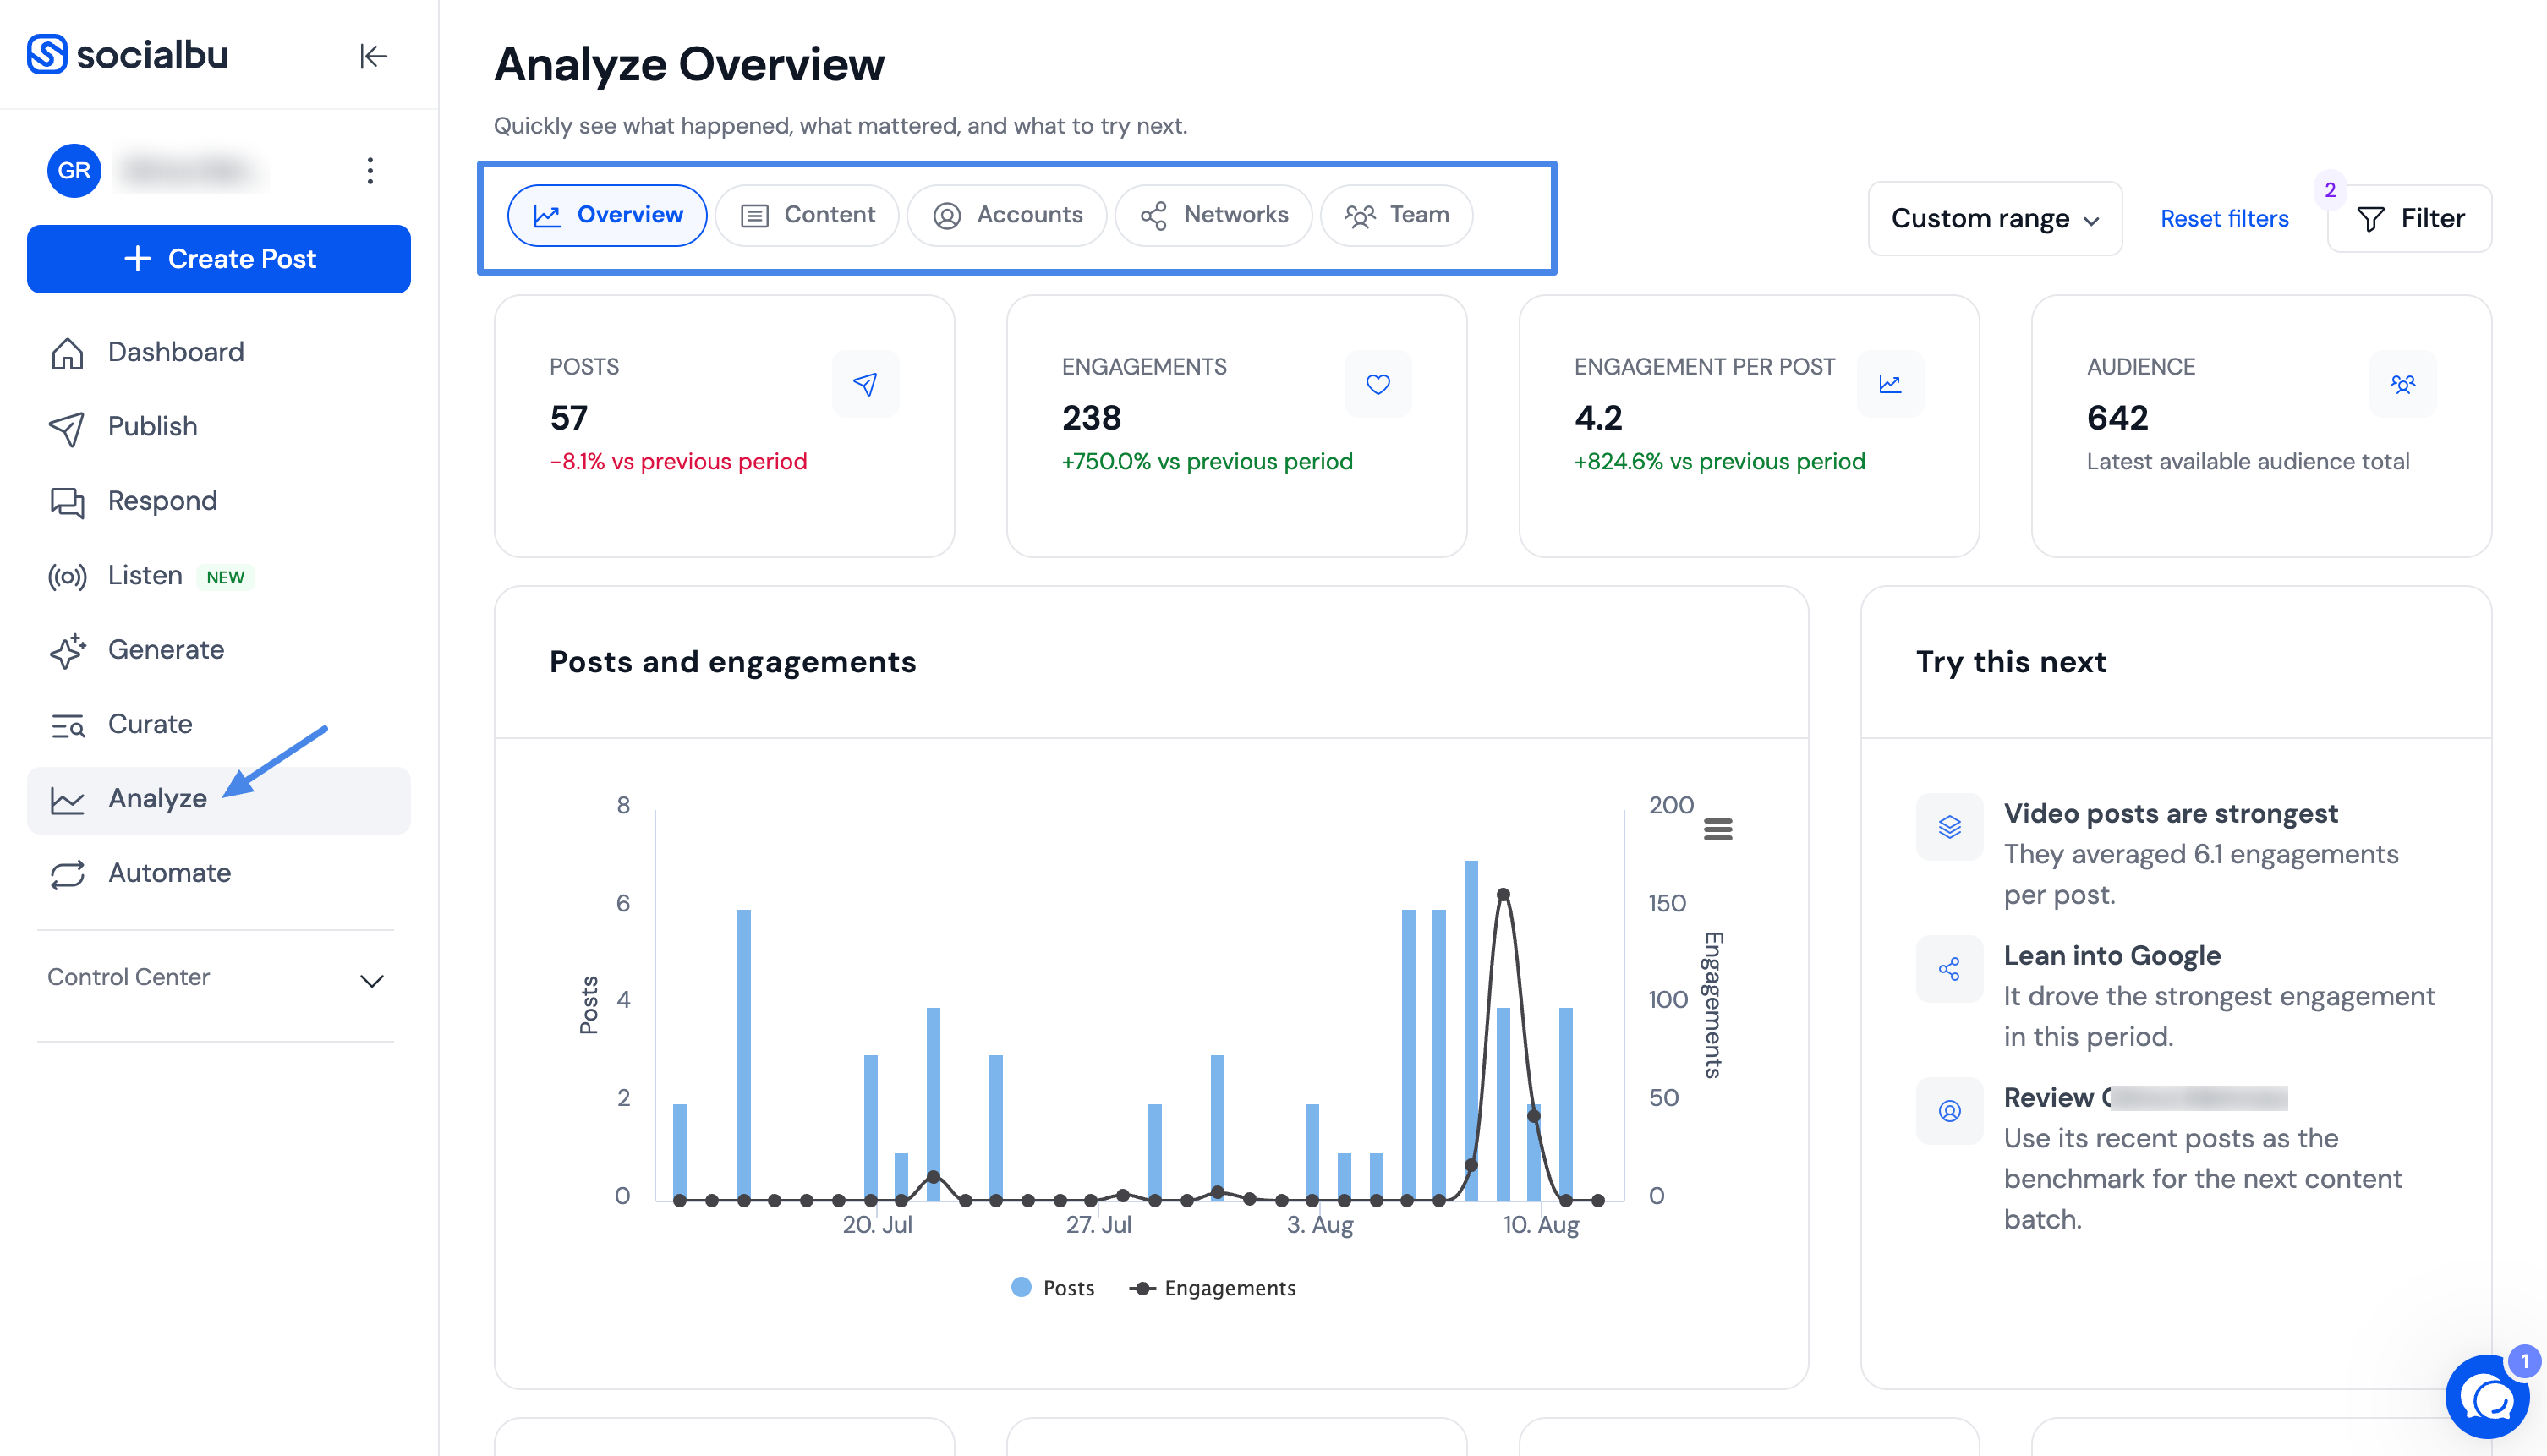
The Analyze section gives you a clear view of your social media performance across connected accounts. You can review high-level performance, content engagement, account growth, network-specific reports, and team activity from one place.
To open it, go to Analyze from your SocialBu dashboard, then choose the report tab you want to review, such as Overview, Content, Accounts, Networks, or Team.
Reports Available in Analyze
SocialBu currently includes these report tabs in the Analyze section:
1. Overview
The Overview report gives you a quick summary of what happened across your connected accounts, including overall performance, important activity, and top-performing content.
2. Content Performance
Content Performance helps you understand how your published posts are performing. It includes:
Posts vs Engagements
Publishing Behavior by post format, such as text, image, and video posts
Top Posts for the selected date range and filters
These insights help you see what type of content gets the most engagement from your audience.
3. Account Performance
Account Performance lets you compare connected accounts over time. It focuses on:
Growth, such as followers, fans, or subscribers where supported
Engagements received
Accounts Overview, including latest available account metrics
The exact metrics shown depend on the connected social network and the data available from that platform.
4. Network Performance
Network Performance shows platform-specific reports for supported networks. Dedicated Network Performance reports are currently available for Instagram Business, Facebook Page, X/Twitter, LinkedIn Organization/Brand, Google Business Profile, and Pinterest.
Depending on the network, you may see metrics such as followers, impressions, reach, profile views, page views, actions, audience demographics, clicks, reviews, and other platform-specific insights.
5. Team Performance
Team Performance helps you review how team members contribute to publishing and engagement. It includes:
Total engagements
Scheduled posts
Published posts
Rejected posts
Top members
Top posts
This is useful for teams and agencies that manage social media with multiple contributors.
Note:
Hashtag engagement insights have been discontinued and are no longer available in Analyze.
SocialBu Metrics Guide by Platform and Post Type
SocialBu shows different metrics depending on the social network, account type, post type, and platform API availability.
Instagram Post Metrics
Facebook Page Post Metrics
LinkedIn Post Metrics
X/Twitter Post Metrics
Pinterest Post Metrics
Google Business Profile Metrics
Google Business Profile post metrics are not currently supported. For Google Business Profile locations, SocialBu can show account/location-level metrics such as desktop map views, mobile map views, website actions, phone actions, driving direction actions, and reviews.
Other Supported Metrics
Some SocialBu analytics endpoints also support metrics for YouTube, Threads, Bluesky, Mastodon, Reddit, TikTok account metrics, and other supported networks. Availability may vary by account type and platform API permissions.
Common Metrics Across Networks
The following metrics are commonly used in top posts and engagement reports where supported:
Likes
Comments
Shares
Reactions
Saves
Video views
Impressions or views
Total interactions
Filters and Date Range
You can filter Analyze reports by date range, team, connected accounts, network, and interval where available. The available filters may change depending on the report tab you are viewing.
How to Download Graphs or Charts
Graphs and charts in Analyze can be downloaded from the chart menu where available. Chart export options may include PDF, PNG, JPEG, or fullscreen view, depending on the chart controls.
Using Analyze Filters and Date Ranges
Use the filters at the top of Analyze reports to control which data appears. Depending on the report, you can filter by team, account, network, date range, and interval.
Quick date buttons: Use options such as 7D, 30D, 90D, This month, or Last month to switch reporting periods quickly.
Custom range: Select a custom start date and end date when you need an exact reporting period.
Interval: Group chart data by the available interval options, such as daily, weekly, or monthly, where supported.
Reset filters: Use Reset filters to clear selected filters and return to the default report view.
Apply: After changing filter values, click Apply to refresh the report.
If a tab or chart looks different for different accounts, it usually means the selected platform, account type, permissions, or date range supports different metrics.

FAQs
Are reports available for all users?
Analyze is available based on your SocialBu plan, team access, connected accounts, and platform permissions. Some reports or advanced metrics may require the right plan or access level.
Can I download Analyze charts?
You can download supported charts and graphs from the chart menu where available. Export options may include PDF, PNG, JPEG, or fullscreen view, depending on the chart controls.
Why does a tab or chart look different for different accounts?
Analyze adapts to the selected platform, account type, permissions, and available API data. Some accounts may show more metrics, filters, or charts than others.
How often is the data updated?
Analytics are updated regularly, but exact timing can vary depending on the social network, API availability, account permissions, and when SocialBu last fetched the data.
Why do some metrics not appear for my account?
Metric availability depends on the social network, account type, post type, permissions, and API limitations. If a platform does not provide a specific metric, SocialBu cannot display it.
Can I compare multiple accounts?
Yes. You can use filters to compare selected accounts, teams, or networks where supported.
Can I see team member contributions?
Yes. Team Performance shows publishing activity, engagement totals, top members, and top posts for the selected team.
Access, filters, and data availability
Plan access: Availability depends on your SocialBu plan. Advanced analytics are available on supported paid plans; Free and Starter may not include advanced analytics access.
Team access: Team members need the View analytics permission to view analytics for a team.
Date presets: Analyze includes quick date presets for Last 7 days, Last 30 days, Last 90 days, This month, and Last month. You can also use a custom date range.
Missing data vs zero data: A zero means SocialBu has data and the value is 0. Missing or blank data usually means the metric is not available yet, the selected date range has no synced data, the account was recently connected, permissions are limited, or the social network does not provide that metric through its API.
Sync delays: Recent metrics can take time to appear because each platform processes and shares analytics on its own schedule. Recheck later, widen the date range, or reconnect the account if data stays outdated.
Dedicated Network Performance reports
Dedicated Network Performance report pages are currently available only for Instagram Business, Facebook Page, X/Twitter, LinkedIn Organization/Brand, Google Business Profile, and Pinterest. Other connected networks may still appear in Overview, Content, Account, Top Posts, or metric reports where SocialBu has supported data, but they do not have their own dedicated Network Performance page yet.
Need Further Assistance?
If you have any other concerns or queries, email us at support@socialbu.com.